Wind on the high ground
Cairn Gorm summit observations help us compare wind and gust estimates with a measured record.
See the wind checks →Better forecasts start with looking at what really happened.
I'm Simon Grogan, a Mountain Leader, software developer and the founder of Mountain Weather. I want forecasts to help people make better plans for the hills, with a clear view of where the guidance holds up and where it falls short.
Did the cloud lift when we expected? Was the wind stronger on the ridge? We put forecasts alongside observations and publish the useful findings, including the misses. The aim is to help you judge how much weight to put on a forecast.
Yr Wyddfa, 8 September 2026 at 07:41 BST. Start with a clear view, add the expected cloud heights, then see what happened. The final view shows how 3D terrain helps us put a height to what we see.
Choose a step to compare the views. Pause the cycle to take a closer look.
A photograph from 19 June 2025 gives us the visible ridges to align with our terrain model. It is a reference from a different day.
Yellow traces show the east and west height estimates on the more distant slopes. Wind is from the west, with lower cloud expected on that side.
The forecast heights broadly agree in parts of the view, but the western forecast trace is lower than several visible contacts. Those differences are what we want to investigate.
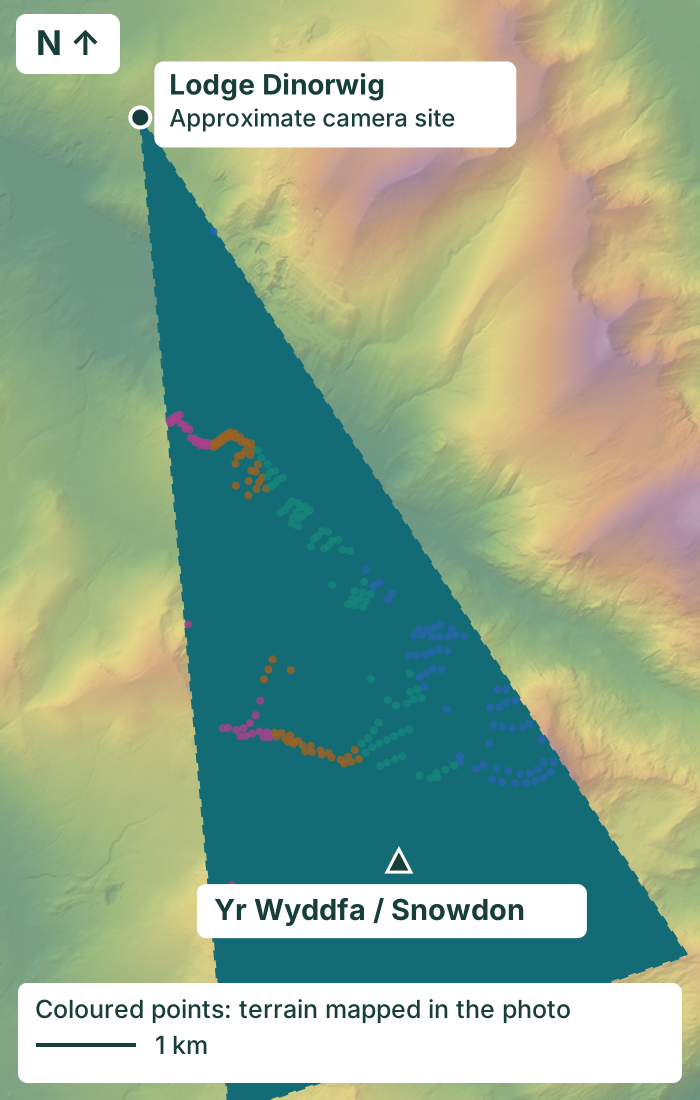
Contours at 100 m intervals show approximate terrain heights above sea level, with labelled 400, 600, 800 and 1,000 m levels. The LiDAR reconstruction links image positions to this visible ground. Foreground ridges can hide the mountain behind them, so every point needs a clear line of sight.
A field test you can inspect, not an accuracy score. These are current calculations replayed from inputs saved on 7 September, with hourly guidance interpolated to the photo time. They are not a recovered copy of the original published forecast. We are testing both the flank adjustments and camera alignment. Yellow traces locate the approximate height estimates on the terrain; they are not a predicted cloud outline or an uncertainty band.
Our server saves a frame twice an hour between dawn and dusk, checking its timestamp and skipping duplicates.
We mark where cloud appears to meet terrain and retain uncertain views. These image labels help train Python to propose a line of contact dots for review.
We hold out whole dates when comparing automatic dots with human marks. We also need forecast-blind observations and independent geometry checks before publishing cloud-base accuracy.
Now testing: blue-sky patches and snow. Early image tests are helping us distinguish breaks in the sky from snow on the ground. The next challenge is making that work across different cameras, light and weather. A patch of blue alone cannot tell us the cloud base or prove the summit is clear.
Explore cloud-base observations for Snowdon and Tryfan. View the cameras, step through the terrain and cloud analysis, or download a day's height readings.
The cloudy photograph is from 8 September 2026 at 07:41:07 BST. Forecast inputs were saved on 7 September. Overall hourly cloud-base estimates change from 1,026 m at 07:00 BST to 500 m at 08:00 BST; the displayed calculation assumes a gradual change between them. The exact timing of a cloud change may differ.
The east and west estimates use our provisional windward and sheltered-flank adjustments. They are drawn separately on terrain more than 5 km from the camera, leaving the centre unassigned. The cloud photograph is shifted two image pixels horizontally to align with the reference; no weather content has been altered.
Some development labels were made while forecast guidance was visible. They are useful development labels, but this comparison is not independent forecast validation. The learned detector still produces false cloud dots on the snowy clear-day example, and wisps remain difficult. We have not established a calibrated cloud-height error in metres.
Photographs: Snowdon Webcam Images by DataCymru Ltd, CC BY 4.0. Clear reference · Morning photograph. Original images are unchanged; cropping, alignment and research overlays are added for this presentation.
Terrain contains Welsh Government / Natural Resources Wales LiDAR data under the Open Government Licence v3.0, accessed through DataMapWales. Camera site prior: the map linked from Snowdon Webcam. Example data and provenance.
Cairn Gorm summit observations help us compare wind and gust estimates with a measured record.
See the wind checks →Webcams and terrain models help us investigate cloud height. Unclear views stay uncertain, not forced into a result.
Follow the camera work →SEPA rain gauges give us another check on rainfall, with the location and limits of each comparison explained.
See the rainfall checks →And the terrain between the readings? Explore our Snowdon route wind beta: controlled wind scenarios over a detailed terrain model, showing how exposure can differ between routes. A model to explore, not a measured wind map.
A webcam overlooking a hill. A weather station with an archive. A walking group's notes from ordinary days out. Or mountain data we have not thought of yet.
Tell me what you have and where it comes from. I can help work out whether it could support a useful check, agree how it is used and credited, and share what we learn.
You do not need to be a weather expert, and sharing a missed forecast is just as welcome as sharing a good one.
Simon Grogan
Founder and lead developer · Mountain Leader
We make our explanations and published results freely accessible. That does not make every source dataset or photograph free to reuse. We agree permission before publishing contributions.