Tell us what you found
A dated photo or a note about cloud, wind or clearance can flag something worth checking. Include the place, time and direction of view, plus the forecast you used if you have it. An ordinary hill day is useful too.
Photographs, summit measurements and the checks behind your mountain forecast.
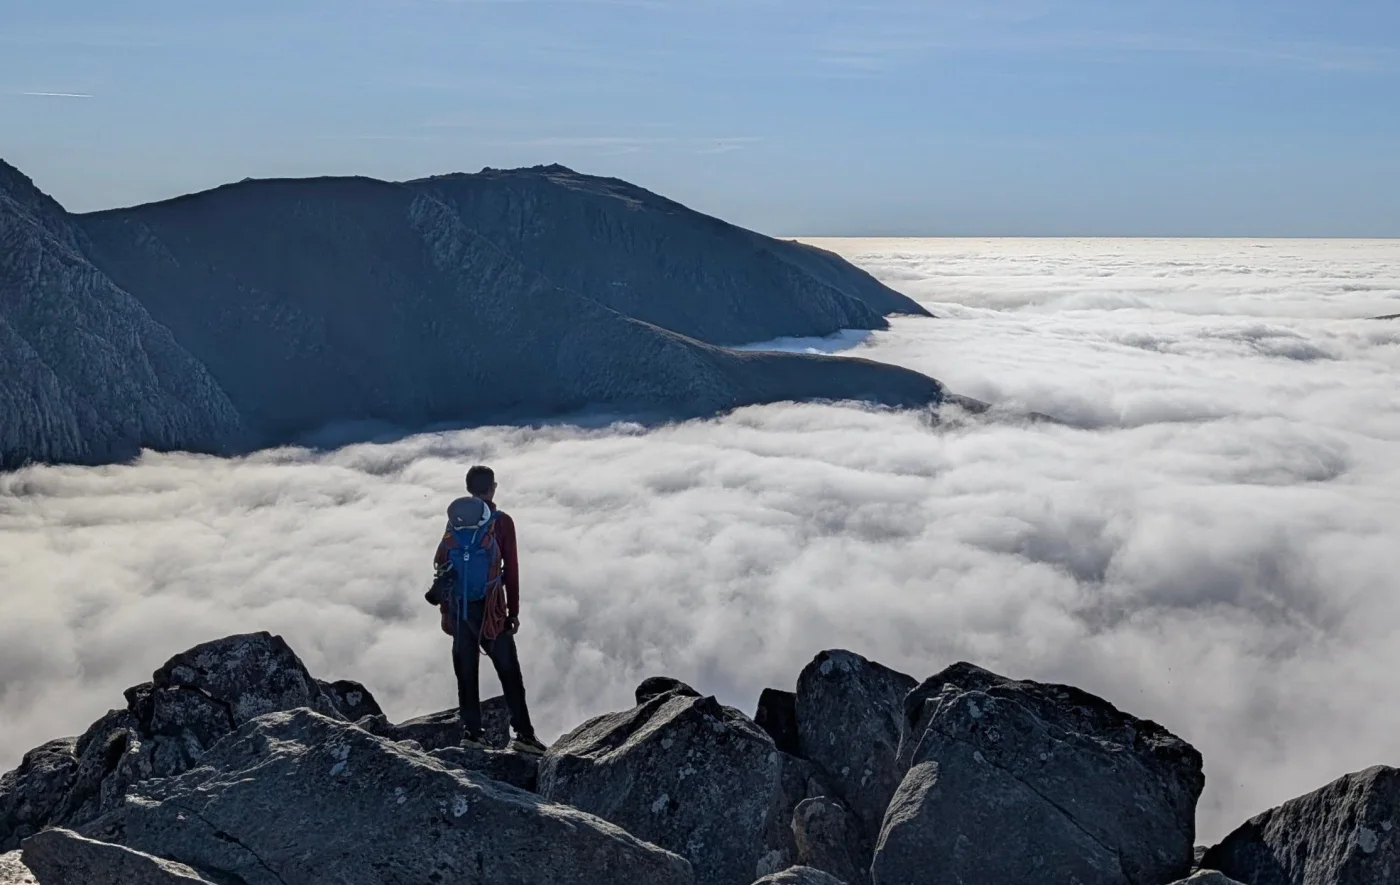
Yr Wyddfa · 8 September 2026 · 07:41 BST
A photograph from 19 June 2025 gives us the visible ridges to align with our terrain model. It is a reference from a different day.
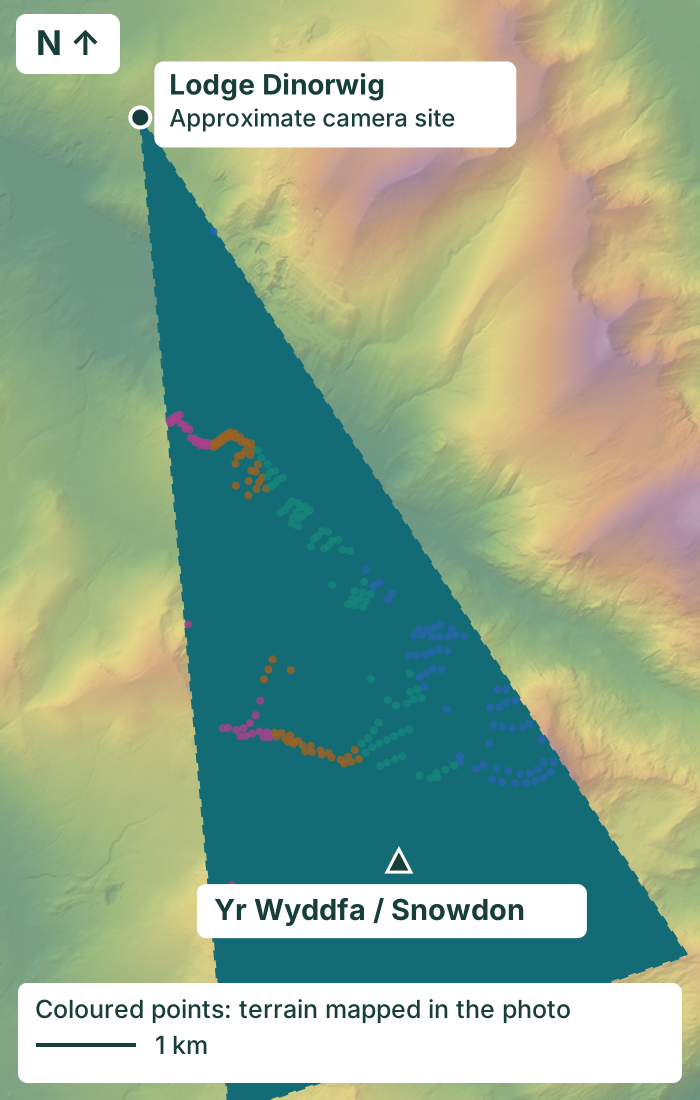
Yellow traces show the east and west height estimates on the more distant slopes. Wind is from the west, with lower cloud expected on that side.
The forecast heights broadly agree in parts of the view, but the western forecast trace is lower than several visible contacts. Those differences are what we want to investigate.
Contours at 100 m intervals show approximate terrain heights above sea level, with labelled 400, 600, 800 and 1,000 m levels. The LiDAR reconstruction links image positions to this visible ground. Foreground ridges can hide the mountain behind them, so every point needs a clear line of sight.
A field test you can inspect, not an accuracy score. These are current calculations replayed from inputs saved on 7 September, with hourly guidance interpolated to the photo time. They are not a recovered copy of the original published forecast. We are testing both the flank adjustments and camera alignment. Yellow traces locate the approximate height estimates on the terrain; they are not a predicted cloud outline or an uncertainty band.
Our server saves a frame twice an hour between dawn and dusk, checking its timestamp and skipping duplicates.
We mark where cloud appears to meet terrain and retain uncertain views. These image labels help train Python to propose a line of contact dots for review.
We hold out whole dates when comparing automatic dots with human marks. We also need forecast-blind observations and independent geometry checks before publishing cloud-base accuracy.
Now testing: blue-sky patches and snow. Early image tests are helping us distinguish breaks in the sky from snow on the ground. The next challenge is making that work across different cameras, light and weather. A patch of blue alone cannot tell us the cloud base or prove the summit is clear.
Explore cloud-base observations for Snowdon and Tryfan. View the cameras, step through the terrain and cloud analysis, or download a day's height readings.
The cloudy photograph is from 8 September 2026 at 07:41:07 BST. Forecast inputs were saved on 7 September. Overall hourly cloud-base estimates change from 1,026 m at 07:00 BST to 500 m at 08:00 BST; the displayed calculation assumes a gradual change between them. The exact timing of a cloud change may differ.
The east and west estimates use our provisional windward and sheltered-flank adjustments. They are drawn separately on terrain more than 5 km from the camera, leaving the centre unassigned. The cloud photograph is shifted two image pixels horizontally to align with the reference; no weather content has been altered.
Some development labels were made while forecast guidance was visible. They are useful development labels, but this comparison is not independent forecast validation. The learned detector still produces false cloud dots on the snowy clear-day example, and wisps remain difficult. We have not established a calibrated cloud-height error in metres.
Photographs: Snowdon Webcam Images by DataCymru Ltd, CC BY 4.0. Clear reference · Morning photograph. Original images are unchanged; cropping, alignment and research overlays are added for this presentation.
Terrain contains Welsh Government / Natural Resources Wales LiDAR data under the Open Government Licence v3.0, accessed through DataMapWales. Camera site prior: the map linked from Snowdon Webcam. Example data and provenance.
Measured at 1,245 metres
We replayed our summit-wind calculation against the Cairn Gorm automatic weather station, using 642 matched sample-hours across 29 dates from 7 July to 5 August 2026.
The calculation followed the rise and fall of summit winds closely. Mean winds differed from the station samples by 4.7 mph on average. Individual errors could be larger, particularly in strong and westerly winds, which were more often underestimated. That gives us a specific problem to work on, then check again on fresh days.
This is a summer development test at station height, before adjusting winds to walker height. It tests the summit calculation, not the accuracy of forecasts issued several days ahead.
| Measurement | Average error | Signed bias | Correlation |
|---|---|---|---|
| Mean wind | 4.7 mph | -0.18 mph | 0.90 |
| Gust | 6.0 mph | +1.17 mph | 0.90 |
Average error is mean absolute error: overestimates and underestimates do not cancel. Bias keeps their sign. Correlation describes how closely winds rise and fall together; it is not percentage accuracy.
Both station samples within an hour must pass quality checks; conflicting duplicates are excluded. These are sampled conditions, not continuous full-hour means or maximum gusts. The dates were used during development, so this is not an independent test or evidence for all UK hills, winter conditions or walker-height accuracy.
You know the ridge that catches every gust, the corrie that holds the cloud and the moment the tops finally clear. That experience belongs in the conversation about better mountain forecasts.
We are building a service people can use, question and help improve. Come along for the good days, the missed clearances and the discoveries that make the next test better.
You do not need to be a weather expert. Start a conversation with Simon, or add a free forecast to your website.
Show the working. Learn from the misses. We publish selected examples, methods and results so you can follow the work here. Contributions are reviewed before use, with permission agreed before publishing anyone's photographs or data. Informal reports help us find questions; measured, independently checked observations help us answer them.
From model data to mountain meaning
Is it above the tops, wrapped around the summit, or below you in an inversion? A daily symbol also loses the sequence: a dry morning followed by rain is a different prospect from a wet start that clears.
Our written forecast brings together height, exposure and timing. It explains where conditions differ, how they change and which parts of the outlook are less certain. Scores and symbols help you compare days; the report helps you understand them.
Read the trend as well as the numbers. If rain is expected to arrive but its timing is uncertain, the important message is that the day is deteriorating.
We keep the large-scale weather, local terrain and practical impact distinct before bringing them into one report.
Pressure-level wind provides a high-ground starting point. Forecast temperature, moisture and precipitation describe the wider weather pattern.
Summit height, directional exposure and upwind shelter inform local adjustments. Regional reports use a representative height for that area.
We compare cloud layers with summit height and assess rain, cold, thunder and spate signals over their relevant periods.
The result becomes timed descriptions, broad ranges and hill-day grades. Confidence remains separate from how favourable the weather looks.
Refreshed twice daily. A full seven-day update each evening, plus an early-morning update for the current day. Check the issue time on your forecast.
A sheltered approach and an open ridge can experience very different winds. Our terrain calculations consider what lies upwind, not just how high the summit is.
Airflow can speed up over high ground. An open Cairngorm plateau and a narrow Eryri ridge have different terrain profiles, so a single height correction is not enough.
Upwind terrain can reduce the mean wind, while gaps and aligned valleys can channel it. Shelter from the average flow does not mean freedom from gusts or turbulence.
We distinguish wind at a station mast from the near-ground layer occupied by a walker. Surface conditions and exposure matter when translating between the two.
Our prepared study applies the same 40 mph background wind at 10 m above ground across the terrain. The comparison shows how route-level exposure changes in the model.
These are controlled scenarios, not today's forecast. The route average can hide a short, exposed section.
Explore the route wind map| Route | Average | Exposed |
|---|---|---|
| Llanberis Path | 25 | 38 |
| Pyg Track | 15 | 38 |
| Watkin Path | 9 | 20 |
Exposed: the wind exceeded along the windiest 5% of the sampled route. Values describe the modelled mean flow, not gusts. Both bar columns use the same 0 to 60 mph scale.
The map illustrates terrain effects; it does not establish which route is safe or validate local turbulence.
Moist air can cool and form cloud as it rises over a mountain. A windward slope may stay capped while the valley below remains clear; an inversion can put the summit above the cloud instead.
Ranges describe uncertainty around the cloud edge. They are not a promise of clearance at an exact height or minute.
Recent rain can matter as much as the next shower. Our spate guidance considers recent and forecast rainfall over relevant periods, with observed rainfall context where available. It flags conditions that may affect burns and approaches; it does not measure the water at your crossing.
Crag outlooks bring together rock type, rain, sunshine, dew and directional exposure. Camping outlooks focus on overnight wind, rain, temperature and condensation. These activity-specific assessments are separate from the summit hill-day score.
Climbing forecasts · Wild camping forecasts · Sea-crag research preview
Each hourly calculation starts from 100. Deductions reflect the weather's likely impact on a hill day. The grade summarises conditions, not a percentage chance of a safe outing.
Sustained wind and gusts contribute an approximate load on a walker. As wind speed rises, its physical effect grows faster than the speed alone, so stronger winds carry larger penalties.
Rain amount, chance and type, wind chill and wintry precipitation reduce the score. Summit cloud and poor visibility add to the overall impact.
Thunder and spate signals can apply further deductions or caps during the affected period. Favourable conditions elsewhere in the day do not cancel a warning.
Hourly scores feed the daily and morning/afternoon grades. A separate main walking window helps explain when conditions are most relevant to a summit visit. Read the window labels and trend, not just the daily total.
| Score | Grade and meaning |
|---|---|
| 85 to 100 | ExcellentMost favourable overall weather band. |
| 70 to 84 | GoodGenerally favourable, with some weather limitations. |
| 50 to 69 | MixedA more noticeable mix of weather challenges. |
| 0 to 49 | PoorUnfavourable conditions with greater weather impacts. |
| Shown as 0 | Severe hill conditionsThe underlying score is below zero. Read the specific hazards. |
A raw score of exactly zero remains Poor. Missing data is Unavailable, never a zero score. No grade guarantees clear tops or a suitable route.
Each representative crag sector starts at 100. Points are deducted for weather likely to reduce climbing quality or comfort. It is a comparison score, not the probability of dry rock and not a safety rating.
We total modelled rain over the preceding 24 and 72 hours and find the time since meaningful rain. Every subsequent hour can add drying according to sunshine, shade, wind, temperature and humidity. Rock type, seepage tendency, season and dew risk change how cautiously that drying is interpreted.
Forecast rain during normal climbing hours always counts. A small amount carries a modest allowance because its precise location can be uncertain; persistent or heavier rain can limit the score even if the rest of the day looks favourable.
Wind on the face begins to reduce comfort above light-breeze levels. Where topping out or top-belaying is relevant, stronger wind above the crag can add a smaller deduction. Cold, heat and strong sunshine are assessed separately.
Thunder can sharply reduce or cap the result. Wet sandstone and gritstone rules can prevent a recommendation because holds may be more vulnerable when damp. A favourable score never overrides access restrictions or conditions found at the crag.
| Score | Grade and meaning |
|---|---|
| 80 to 100 | PromisingThe broad weather signal is favourable, subject to local checks. |
| 65 to 79 | PossibleSome limitations are likely to affect the session. |
| 45 to 64 | UncertainConditions could be marginal or vary significantly by sector. |
| 0 to 44 | PoorWeather or surface conditions are unfavourable. |
On each crag page, expand Why this score? to see the actual deductions for that sector. Rain history is modelled rather than measured at the crag, and drying estimates do not resolve individual seepage lines, polished holds or vegetation.
Our Scottish rainfall pilot checks archived guidance against SEPA gauges at Glen Nevis and Spey Dam, including missed wet spells and false alarms. See how we check rainfall →
See what each source contributes: ideas behind the method, checks against measurements, and datasets used or being explored.
Met Office research describes how hills enhance precipitation, block flow and generate turbulence, waves and locally hazardous wind.
Role in our work: It supports our decision to begin with high-ground atmospheric flow, then treat elevation, exposure and terrain effects separately rather than simply moving a low-level forecast uphill.
US Forest Service research tests high-resolution wind downscaling against observations in complex terrain rather than assuming one uniform surface wind.
Role in our work: It informs the use of directional exposure and upwind shelter as bounded adjustments, together with the requirement to test terrain rules against observations.
MeteoSwiss documents why finer topography and multiple forecast members matter in steep Alpine terrain, including the limits created by unresolved turbulence.
Role in our work: It reinforces our use of ranges and confidence when credible forecast outcomes disagree, especially where a forecast grid cannot resolve every ridge, corrie or turbulent eddy.
Field measurements and wind-tunnel and CFD comparisons show that landforms on tens-to-hundreds-of-metres scales can materially change hilltop wind.
Role in our work: It supports applying limited, landform-aware speed-up or shelter effects rather than one blanket correction across every mountain and wind direction.
The Icelandic Meteorological Office publishes a linked body of work on station records, empirical terrain models, mesoscale evaluation and statistical correction.
Role in our work: It helps shape our validation approach: terrain adjustments should be checked against stations and tested away from the places or storms used to develop them.
International guidance for surface-wind measurement, exposure, height and quality assurance.
Role in our work: Defines the like-for-like measurement basis for validation. This is why the summit-station comparison uses mast-equivalent wind and excludes the later walker-height adjustment.
A long-running 1,245 m observation record used for like-for-like wind checks.
Role in our work: Provides the quality-checked mean-wind and gust samples used in the 642 paired sample-hours shown here. Both station samples within each hour must pass the observation checks.
The scientific case for comparing credible outcomes instead of treating one run as certainty.
Role in our work: Informs how we separate forecast confidence from the weather rating and why the public forecast uses ranges when credible outcomes diverge.
UK hourly observations including cloud-base height, visibility, wind, gust, temperature and sunshine.
Role in our work: Provides a standardised archive for expanding UK validation across places, seasons and variables; it is a reference and testing resource, not a live input to every forecast.
Cloud-base and vertical-profile measurements from European ceilometer and lidar networks.
Role in our work: A candidate for extending cloud validation where instrument access, reuse terms and mountain geometry can be matched. It is not yet a published verification result.
The lifting condensation level as a useful physical estimate of cloud base during forced ascent.
Role in our work: Acts as a physical sense-check on possible cloud base. It is not used alone because mountain cloud also depends on moisture depth, stability, wind and terrain.
Quality-checked rain-gauge measurements at Glen Nevis and Spey Dam used in our Scottish rainfall pilot.
Role in our work: Tests archived rainfall guidance against measured amounts, wet periods and timing. These are checks at the gauge locations, not proof of summit rainfall, dry rock or safe river crossings.
A consistent reconstruction of past atmospheric conditions, combining a weather model with historical observations.
Role in our work: Provides weather context for dates in our exploratory participation research. Reanalysis describes likely past conditions at grid scale; it is not a summit observation or the forecast that walkers saw at the time.
Published counter-derived daily and hourly activity for a four-Munro circuit in Glen Lyon during parts of 2017 to 2019.
Role in our work: Lets us estimate how much recorded hill activity differs between historical rain-and-gust categories, after allowing for calendar effects. The value is in quantifying the relationship, with uncertainty, rather than simply identifying its direction.
Showing all sources.
Start with the regional picture, then open the forecast for your summit. Use the written report, timing and confidence together with official warnings and what you find on the hill.
Find your mountain forecast